Thứ Sáu, 20 tháng 12, 2013

Bài Tập 19.2 (tham khảo) - Zeus Analysis in Volatility

In this post I'm going to talk about Volatility. Volatility is one of  the best tools for memory forensics. It is an open source framework writen in python for incident response and malware analysis.

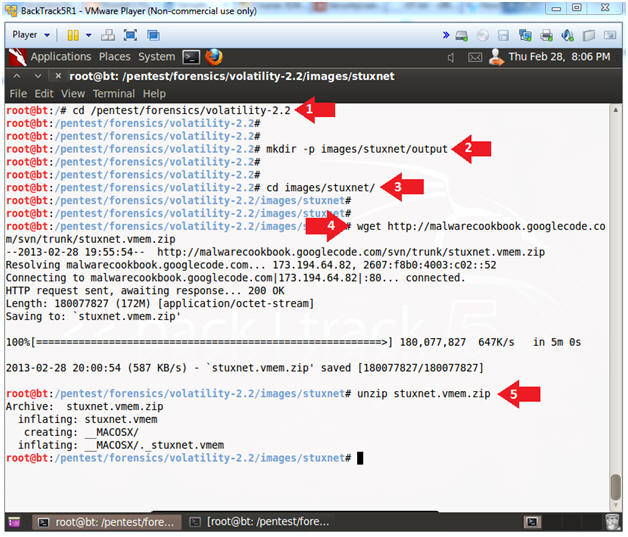
Thanks to Malware Analyst's Cookbook we can get a real memory dump from an infected host with Zeus Trojan. You can donwload zeus.vmem.zip [41,4 MB]
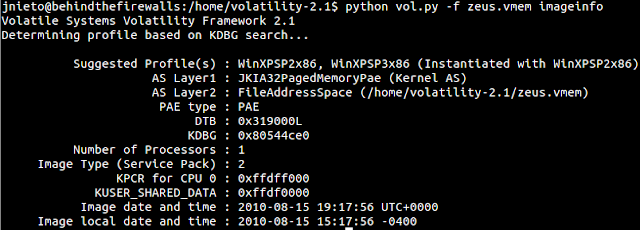
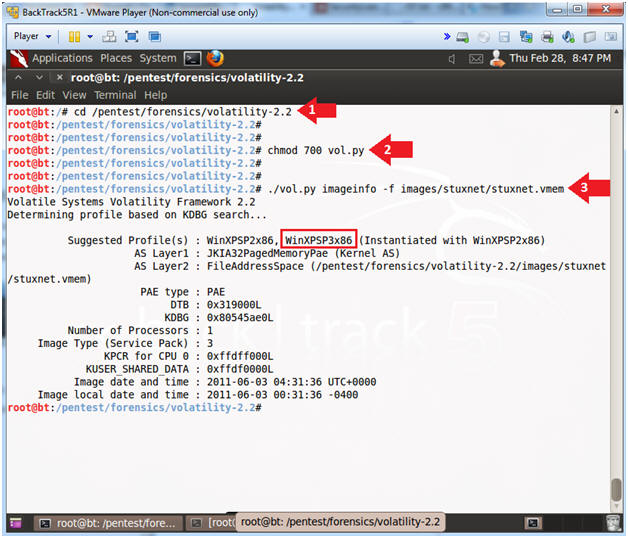
1) With the option "imageinfo" you can find out what type of OS was running.
1
python vol.py -f zeus.vmem imageinfo


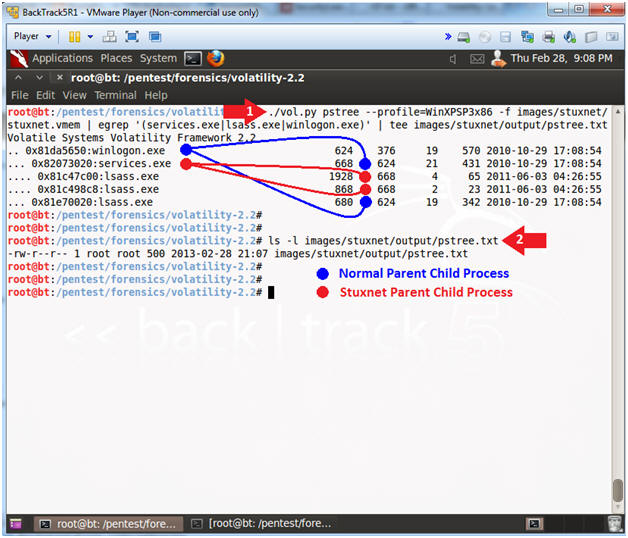
2) Now, we are going to watch what processes were running on the computer when the memory dump was recorder.
1
python vol.py -f zeus.vmem pstree


3) I couldn't see anything weird... I wanted to know if the machine was making connections...
1
python vol.py -f zeus.vmem connscan


4) Ok. Our machine was making connections with 193.104.47.75 by the 80/tcp port. The proccess Pid is 856. We want to know whether this process belong to an Internet Browser.

We run it again:
1
python vol.py -f zeus.vmem pstree


5) We can see that svchost.exe is the process which is making connections with193.104.47.75 instead of an Internet Browser... This is not common... Is this IP address blacklisted?

http://www.ipvoid.com/scan/193.104.41.75/

6) As you can see, this IP is blacklisted. It is common that a trojan adds a registry key to be sure that it will be running every time the computer is restarted. Take a look at the Winlongon register key...
1
python vol.py -f zeus.vmem printkey -K "Microsoft\Windows NT\CurrentVersion\Winlogon"
You can see sdra64.exe will run when the computer starts. If you search on Google you can see a lot of websites talking about this process... It seems to be a trojan....
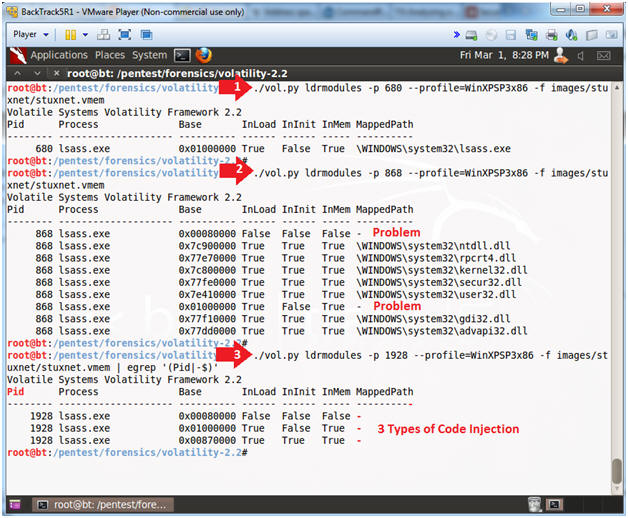
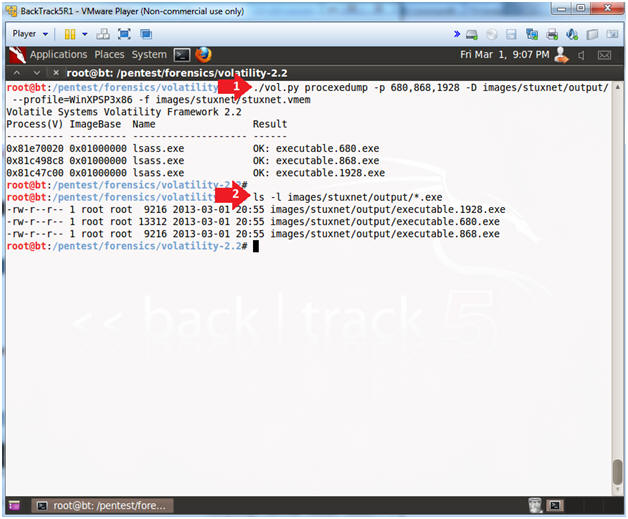
7) Now, we are going to try find a hidden or injected code/DLLs in the user mode memory and dump it...
1
python vol.py -f zeus.vmem malfind --dump-dir evidencias/

8) We are really interested in dumping the process with the Pid 856 which has established connections with the blacklisted servers.


9) Now, I'm going to get the SHA256 hash in order to search in Virustotal and see if this process is recognized by any Antivirus.


https://www.virustotal.com/en/file/8e3be5dc65aa35d68fd2aba1d3d9bf0f40d5118fe22eb2e6c97c8463bd1f1ba1/analysis/


Ok, so far so good.


10) We are going to use the mutantscan command. With this option, we can display all objects.
1
python vol.py -f zeus.vmem mutantscan

We noticed _AVIRA_2108... I don't know where I've heard this before...
1
python vol.py -f zeus.vmem mutantscan | grep AVIRA
I was looking for this object on Google. I visited www.fortiguard.com and found this.
11) This trojan usually shuts down our Firewall.. We can check it with the next command.
1
python vol.py -f zeus.vmem printkey -K "ControlSet001\Services\SharedAccess\Parameters\FirewallPolicy\StandardProfile"


This is evidence that the computer was infected with Zeus Trojan. In the next post, we are going to analyze another memory dump with Volatility.

Thứ Năm, 19 tháng 12, 2013

Hướng Dẫn Thực Hành BackTrack - Add New Disk to BackTrack: Lesson 1

{ Add New Disk, Create Partition Table and Filesystem }

Section 0. Background Information
  • Adding a new disk to a Backtrack 5 VMware Instance
    • In this lab, you will learn how to do the following:
      • Add a new disk
      • Create a partition table for the new disk
      • Create an ext3 filesystem on the new disk
    • This new disk will be added for Forensic Labs.
Section 1. Configure BackTrack Network Adapter Virtual Machine Settings
  1. Open Your VMware Player
    • Instructions:
      1. On Your Host Computer, Go To
      2. Start --> All Program --> VMWare --> VMWare Player
  2. Edit BackTrack Virtual Machine Settings
    • Instructions:
      1. Highlight BackTrack5R1
      2. Click Edit virtual machine settings
  3. Edit Network Adapter
    • Instructions:
      1. Highlight Network Adapter
      2. Select Bridged
      3. Do NOT Click on the OK Button.

Section 2. Add Hard Drive to BackTrack Virtual Machine
  1. Add Device
    • Instructions:
      1. Click on the Add.. Button
  2. Add Hard Disk
    • Instructions:
      1. Click on Hard Disk
      2. Click Next
  3. Select a Disk
    • Instructions:
      1. Select "Create a new virtual disk"
      2. Click Next
  4. Select Virtual disk type
    • Instructions:
      1. Select SCSI (Recommended)
  5. Specify Disk Capacity
    • Instructions:
      1. Maximum disk size (GB): 15.0
      2. Select "Store virtual disk as a single file"
      3. Click Next
  6. Name Disk File
    • Instructions:
      1. Take the default name
      2. Click Finish
  7. View Results
    • Notes:
      • You should see two disk, the original disk and the New Hard Disk.
    • Instructions
      1. Click OK.

Section 3. Login to BackTrack
  1. Start BackTrack VM Instance
    • Instructions:
      1. Start Up VMWare Player
      2. Select BackTrack5R1
      3. Play virtual machine
  2. Login to BackTrack
    • Instructions:
      1. Login: root
      2. Password: toor or <whatever you changed it to>.
  3. Bring up the GNOME
    • Instructions:
      1. Type startx

Section 4. Create New Disk Partition Table
  1. Open a console terminal
    • Instructions:
      1. Click on the console terminal
  2. View Hard Disks
    • Instructions:
      1. fdisk -l
    • Notes:
      • You should see the following two disk names:
        1. /dev/sda: 21.5 GB
          • This is the original disk.
          • Notice there is a partition table
        2. /dev/sdb: 16.1 GB
          • This is the new disk.
          • It contains 1958 cylinders.
          • Notice that /dev/sdb does not have a valid partition table.
  3. Partition the New Disk
    • Instructions:
      1. fdisk -c /dev/sdb
      2. Select m
  4. Partition the New Disk
    • Instructions:
      1. n
        • Add New Disk
      2. p
        • Make Primary Partition
      3. 1
        • "1" is the partition number for disk /dev/sdb.
      4. 1
        • "1" is the first cylinder of the disk.
      5. 1958
        • "1958" is the last cylinder of the disk.
      6. p
        • Print the partition table.
      7. w
        • Write the table to disk and exit

Section 5. Create a new file system
  1. Create a new filesystem
    • Instructions:
      1. mkfs.ext3 /dev/sdb1
        • Create an ext2/ext3/ext4 filesystem
  2. Mount the new filesystem
    • Instructions:
      1. mkdir /FORENSICS
      2. mount /dev/sdb1 /FORENSICS
      3. df -h

Bài Tập 19.1 - Analyzing Stuxnet


Section 0. Background Information
  1. What is Stuxnet?
    • Stuxnet is a threat targeting a specific industrial control system likely in Iran, such as a gas pipeline or power plant. The ultimate goal of Stuxnet is to sabotage that facility by reprogramming programmable logic controllers (PLCs) to operate as the attackers intend them to, most likely out of their specified boundaries. [4]
  2. Pre-Requisite
  3. References
    1. Michael HaleStuxnet's Footprint in Memory with Volatility
    2. Mark RussinovichAnalyzing a Stuxnet Infection with the Sysinternals Tools, Part I
    3. Michael Halehttp://code.google.com/p/volatility/wiki/CommandReference
    4. Symantec's:   W32.Stuxnet Dossier
  4. Lab Notes
    • In this lab we will do the following:
      1. Download a Stuxnet memory capture.
      2. Analyze a Stuxnet memory capture using the above references.
  5. Legal Disclaimer
Section 1. Login to BackTrack
  1. Start Up VMWare Player
    • Instructions:
      1. Click the Start Button
      2. Type Vmplayer in the search box
      3. Click on Vmplayer
  2. Open a Virtual Machine
    • Instructions:
      1. Click on Open a Virtual Machine
  3. Open the BackTrack5R1 VM
    • Instructions:
      1. Navigate to where the BackTrack5R1 VM is located
      2. Click on on the BackTrack5R1 VM
      3. Click on the Open Button
  4. Edit the BackTrack5R1 VM
    • Instructions:
      1. Select BackTrack5R1 VM
      2. Click Edit virtual machine settings
  5. Edit Virtual Machine Settings
    • Instructions:
      1. Click on Network Adapter
      2. Click on the Bridged Radio button
      3. Click on the OK Button
  6. Play the BackTrack5R1 VM
    • Instructions:
      1. Click on the BackTrack5R1 VM
      2. Click on Play virtual machine
  7. Login to BackTrack
    • Instructions:
      1. Login: root
      2. Password: toor or <whatever you changed it to>.
  8. Bring up the GNOME
    • Instructions:
      1. Type startx
Section 2. Bring up a console terminal
  1. Start up a terminal window
    • Instructions:
      1. Click on the Terminal Window
  2. Obtain the IP Address
    • Instructions:
      1. ifconfig -a
    • Note(FYI):
      • My IP address 192.168.1.108.
      • In your case, it will probably be different.
Section 3. Download a Stuxnet Image
  1. Download a Stuxnet Image
    • Instructions
      1. cd /pentest/forensics/volatility-2.2
      2. mkdir -p images/stuxnet/output
      3. cd images/stuxnet/
      4. wget http://malwarecookbook.googlecode.com/svn/trunk/stuxnet.vmem.zip
      5. unzip stuxnet.vmem.zip
Section 4. Determine Volatility Image
  1. Determine Which Profile to Use
    • Instructions
      1. cd /pentest/forensics/volatility-2.2
      2. chmod 700 vol.py
        • Make vol.py executable.
      3. ./vol.py imageinfo -f images/stuxnet/stuxnet.vmem
    • Note(FYI):
      • For this image Volatility tells us to use the WinXPSP3x86 profile.

Section 4. Analyze Stuxnet Process Tree
  1. Basic Stuxnet Description
    • Note(FYI):
      1. A normal Windows XP installation has just one instance of lsass.exe that the Winlogon process creates when the system boots. (Wininit creates it on Windows Vista and higher).
      2. [The following] process tree [example] reveals that the two new lsass.exe instances were both created by services.exe [], the Service Control Manager, which implies that Stuxnet somehow got its' code into the Services.exe process. [1][2].
      3. Mrxnet.sys is the driver that ... implements the rootkit that hides files, and Mrxcls.sys is a second Stuxnet driver file that launches the malware when the system boots. [1]
       
  2. What is lsass.exe
    • Note(FYI):
      • LSASS, or local security authority subsystem service, is a process that functions as part of the Microsoft Windows operating system.
      • LSASS is part of the process for maintaining and enforcing the security protocols on the operating system.
      • LSASS performs several important functions
        1. To ensure that the system remains free from unauthorized access
        2. LSASS oversees access to a computer or server.
        3. LSASS recognizes any restrictions on access to any information on the hard drive or the server.
        4. LSASS makes sure that only recognized access codes or other login credentials will allow persons to interact with password protected files, directories, etc.
  3. Analyze Stuxnet Process Tree
    • Instructions
      1. ./vol.py pstree --profile=WinXPSP3x86 -f images/stuxnet/stuxnet.vmem | egrep '(services.exe|lsass.exe|winlogon.exe)' | tee images/stuxnet/output/pstree.txt
      2. ls -l images/stuxnet/output/pstree.txt
    • Note(FYI):
      • The normal Parent-Child relation
        • winlogon.exe (624) kicks off, DATE: 2010-10-29 17:08:54
          • services.exe (668), DATE: 2010-10-29 17:08:54
          • lsass.exe (680), 2010-10-29 17:08:54
      • The Stuxnet Parent-Child relation
        • services.exe(668) is NOT supposed to, but kicks off
          • lsass.exe (1928), DATE: 2011-06-03 04:26:55
          • lsass.exe (868), DATE: 2011-06-03 04:26:55
        • Notice these two lsass.exe processes were created 216 after winlogin.exe was started.

Section 5. Analyze Sockets
  1. Analyze Sockets
    • Instructions
      1. ./vol.py sockets --profile=WinXPSP3x86 -f images/stuxnet/stuxnet.vmem | egrep '(Off|---|680|1928|868)' | tee images/stuxnet/output/sockets.txt
      2. ls -l images/stuxnet/output/sockets.txt
    • Note(FYI):
      • Another way that you can tell the good lsass.exe (680) processes from the bad (1928 & 868) lsass.exe process is that PID 680 are bound to Port 500 and 4500, while PIDs 1928 & 868 are not.

Section 6. Analyze DLL's
  1. Analyze lsass dll's
    • Instructions
      1. ./vol.py dlllist -p 680 --profile=WinXPSP3x86 -f images/stuxnet/stuxnet.vmem 2>/dev/null | wc -l
      2. ./vol.py dlllist -p 1928 --profile=WinXPSP3x86 -f images/stuxnet/stuxnet.vmem 2>/dev/null | wc -l
      3. ./vol.py dlllist -p 868 --profile=WinXPSP3x86 -f images/stuxnet/stuxnet.vmem 2>/dev/null | wc -l
      4. ./vol.py dlllist -p 680,1928,868 --profile=WinXPSP3x86 -f images/stuxnet/stuxnet.vmem > images/stuxnet/output/dlllist.txt
      5. ls -l images/stuxnet/output/dlllist.txt
    • Note(FYI):
      • [A]nother suspicious characteristic of the two superfluous processes is the fact that they have very few DLLs loaded. [1][2].
      • DLLs are automatically added ... when a process call the  LoadLibrary. [3]
      • Notice that the good PID (680) has 64 DLLs attached to its' process.
      • Notice that the bad PID (1928) has 35 DLLs attached to its' process.
      • Notice that the bad PID (868) has 15 DLLs attached to its' process.

Section 7. Analyze Process IDs with malfind
  1. Analyze Process IDs with malfind
    • Instructions
      1. ./vol.py malfind -p 680 --profile=WinXPSP3x86 -f images/stuxnet/stuxnet.vmem
      2. ./vol.py malfind -p 868 --profile=WinXPSP3x86 -f images/stuxnet/stuxnet.vmem
      3. ./vol.py malfind -p 868,1928 --profile=WinXPSP3x86 -f images/stuxnet/stuxnet.vmem > images/stuxnet/output/malfind.txt
      4. ls -l images/stuxnet/output/malfind.txt
    • Note(FYI):
      • The malfind command has several purposes. You can use it to find hidden or injected code/DLLs in user mode memory, based on characteristics such as VAD tag and page permissions. [3]
      • Services.exe, Lsass.exe or Explorer.exe should not have write permission. 
      • Notice, that PID(680) did not return any results, while PID(868 & 1928) do.

Section 8. Bypassing Behavior Blocking Wheb Loading DLLs
  1. What is Address space layout randomization (ASLR)
    • Note(FYI):
      • Address space layout randomization (ASLR) is a computer security method which involves randomly arranging the positions of key data areas, usually including the base of the executable and position of libraries, heap, and stack, in a process's address space.
  2. Bypassing Behavior Blocking When Loading DLLs
    • Note(FYI):
      • Whenever Stuxnet needs to load a DLL, including itself, it uses a special method designed to bypass behavior- blocking and host intrusion-protection based technologies that monitor LoadLibrary calls. Stuxnet calls Load - Library with a specially crafted file name that does not exist on disk and normally causes LoadLibrary to fail. However, W32.Stuxnet has hooked Ntdll.dll to monitor for requests to load specially crafted file names. These specially crafted filenames are mapped to another location instead�a location specified by W32.Stuxnet. That location is generally an area in memory where a .dll file has been decrypted and stored by the threat previously. The filenames used have the pattern of KERNEL32.DLL.ASLR.[HEXADECIMAL] or SHELL32.DLL.ASLR. [HEXA - DECIMAL], where the variable [HEXADECIMAL]is a hexadecimal values. [4]
  3. Hiding DLLs
    • Instructions
      1. ./vol.py dlllist --profile=WinXPSP3x86 -f images/stuxnet/stuxnet.vmem | grep ASLR
      2. ./vol.py dlllist --profile=WinXPSP3x86 -f images/stuxnet/stuxnet.vmem | grep ASLR > images/stuxnet/output/aslr.txt
      3. ls -l images/stuxnet/output/aslr.txt
    • Note(FYI):
      • Step 1 displays the Stuxnet specially crafted files designed to bypass the ASRL.

Section 9. Using ldrmodules to find hidden DLLs
  1. Using ldrmodules to find hidden DLLs
    • Note(FYI):
      • There are many ways to hide a DLL. One of the ways involves unlinking the DLL from one (or all) of the linked lists in the PEB (Process Enviroment Block). However, when this is done, there is still information contained within the VAD (Virtual Address Descriptor) which identifies the base address of the DLL and its full path on disk. To cross-reference this information (known as memory mapped files) with the 3 PEB lists, use the ldrmodules command. For each memory mapped Portable Executable (PE) file, the ldrmodules command prints a 0 or a 1 if the PE exists in the PEB lists. [3]
     
  2. Using ldrmodules
    • Instructions
      1. ./vol.py ldrmodules -p 680 --profile=WinXPSP3x86 -f images/stuxnet/stuxnet.vmem
        • This is normal.
      2. ./vol.py ldrmodules -p 868 --profile=WinXPSP3x86 -f images/stuxnet/stuxnet.vmem
        • Notice the lines identified by the word "Problem".
      3. ./vol.py ldrmodules -p 1928 --profile=WinXPSP3x86 -f images/stuxnet/stuxnet.vmem | egrep '(Pid|-$)'
    • Note(FYI):
      • The lines identified as a problem are either suspicious because an entry is missing from one of the PEB (Process Enviroment Block) lists or because the path name is blank.

Section 10. Using procexedump to dump process executables
  1. Using procexedump to dump process executables
    • Note(FYI):
      • To dump a process's executable (not including the slack space), use the procexedump command.
       
  2. Using procexedump
    • Instructions
      1. ./vol.py procexedump -p 680,868,1928 -D images/stuxnet/output/ --profile=WinXPSP3x86 -f images/stuxnet/stuxnet.vmem
      2. ls -l images/stuxnet/output/*.exe
  3. Looking at Malicious Hooks
    • Instructions
      1. strings images/stuxnet/output/executable.868.exe | more
    • Note(FYI):